
Export, Share, and Print Dashboard Insights
Using built-in print/export/share options for dashboard insights
The Revenue Recovery Dashboard includes built-in share, export, and print functionality that creates professional, formatted reports of your key performance metrics and insights. You can generate comprehensive reports that are optimized for sharing with stakeholders, executive reporting, or maintaining historical records.
The print and export views automatically reformat dashboard content into multi-page documents with clear sections, proper page breaks, and professional styling suitable for presentation or archival purposes.
Exporting and Sharing the Dashboard
The Revenue Recovery Dashboard provides collaboration options beyond browser printing, offering convenient ways to share insights with stakeholders or send URLs to a filtered dashboard for review. These functions are accessible through the dashboard's built-in sharing tools.
To access the export and sharing options:
- Navigate to the Revenue Recovery Dashboard
- Ensure your desired time period and filters are selected
- Click the Menu button (three horizontal lines) in the top-right corner of the dashboard
- Select your preferred export or sharing option from the dropdown menu

Export to PDF
The Export to PDF option generates a professionally formatted PDF report that maintains all visual elements, charts, and branding. This creates the same multi-page report structure as the browser print function but automatically saves it as a PDF file.
Use Cases:
- Email Distribution: Send comprehensive reports to stakeholders via email
- Document Archival: Maintain historical records of dashboard performance
- Offline Review: Enable viewing and annotation without internet access
- Compliance Documentation: Create formal records for audit and regulatory purposes
Sharing the Dashboard
The Share Report option provides secure sharing capabilities, enabling you to distribute dashboard insights to authorized users within your organization or external stakeholders as appropriate, by sending them a URL to the filtered dashboard.
Use Cases:
- Team Collaboration: Share insights with revenue cycle team members so that they can explore further in the application
- Executive Briefings: Distribute specific dashboard views to leadership and board members
- Vendor Communication: Provide performance data to technology partners
- Cross-Department Reporting: Share relevant metrics with finance, operations, and clinical teams
Both export options respect your current dashboard filters and time period selections, ensuring that shared reports reflect the exact data view you've configured for analysis.
Printing the Dashboard
To generate a printable version of your dashboard insights:
- Navigate to the Revenue Recovery Dashboard
- Ensure your desired time period and filters are selected
- Use your browser's print function:
- macOS: Press
cmd+p - Windows/Linux: Press
ctrl+p
- macOS: Press
- Select your preferred output (PDF save, physical printer, etc.)
The system automatically detects print mode and reformats the content for optimal readability and professional presentation.
Print Layout Overview
The print version organizes dashboard content into a comprehensive multi-page report with professional formatting and clear navigation. Each page maintains visual clarity while presenting detailed analytics in a format suitable for offline review and stakeholder sharing.
The complete print layout includes:
- Cover Page: Report title, date range, and generation details
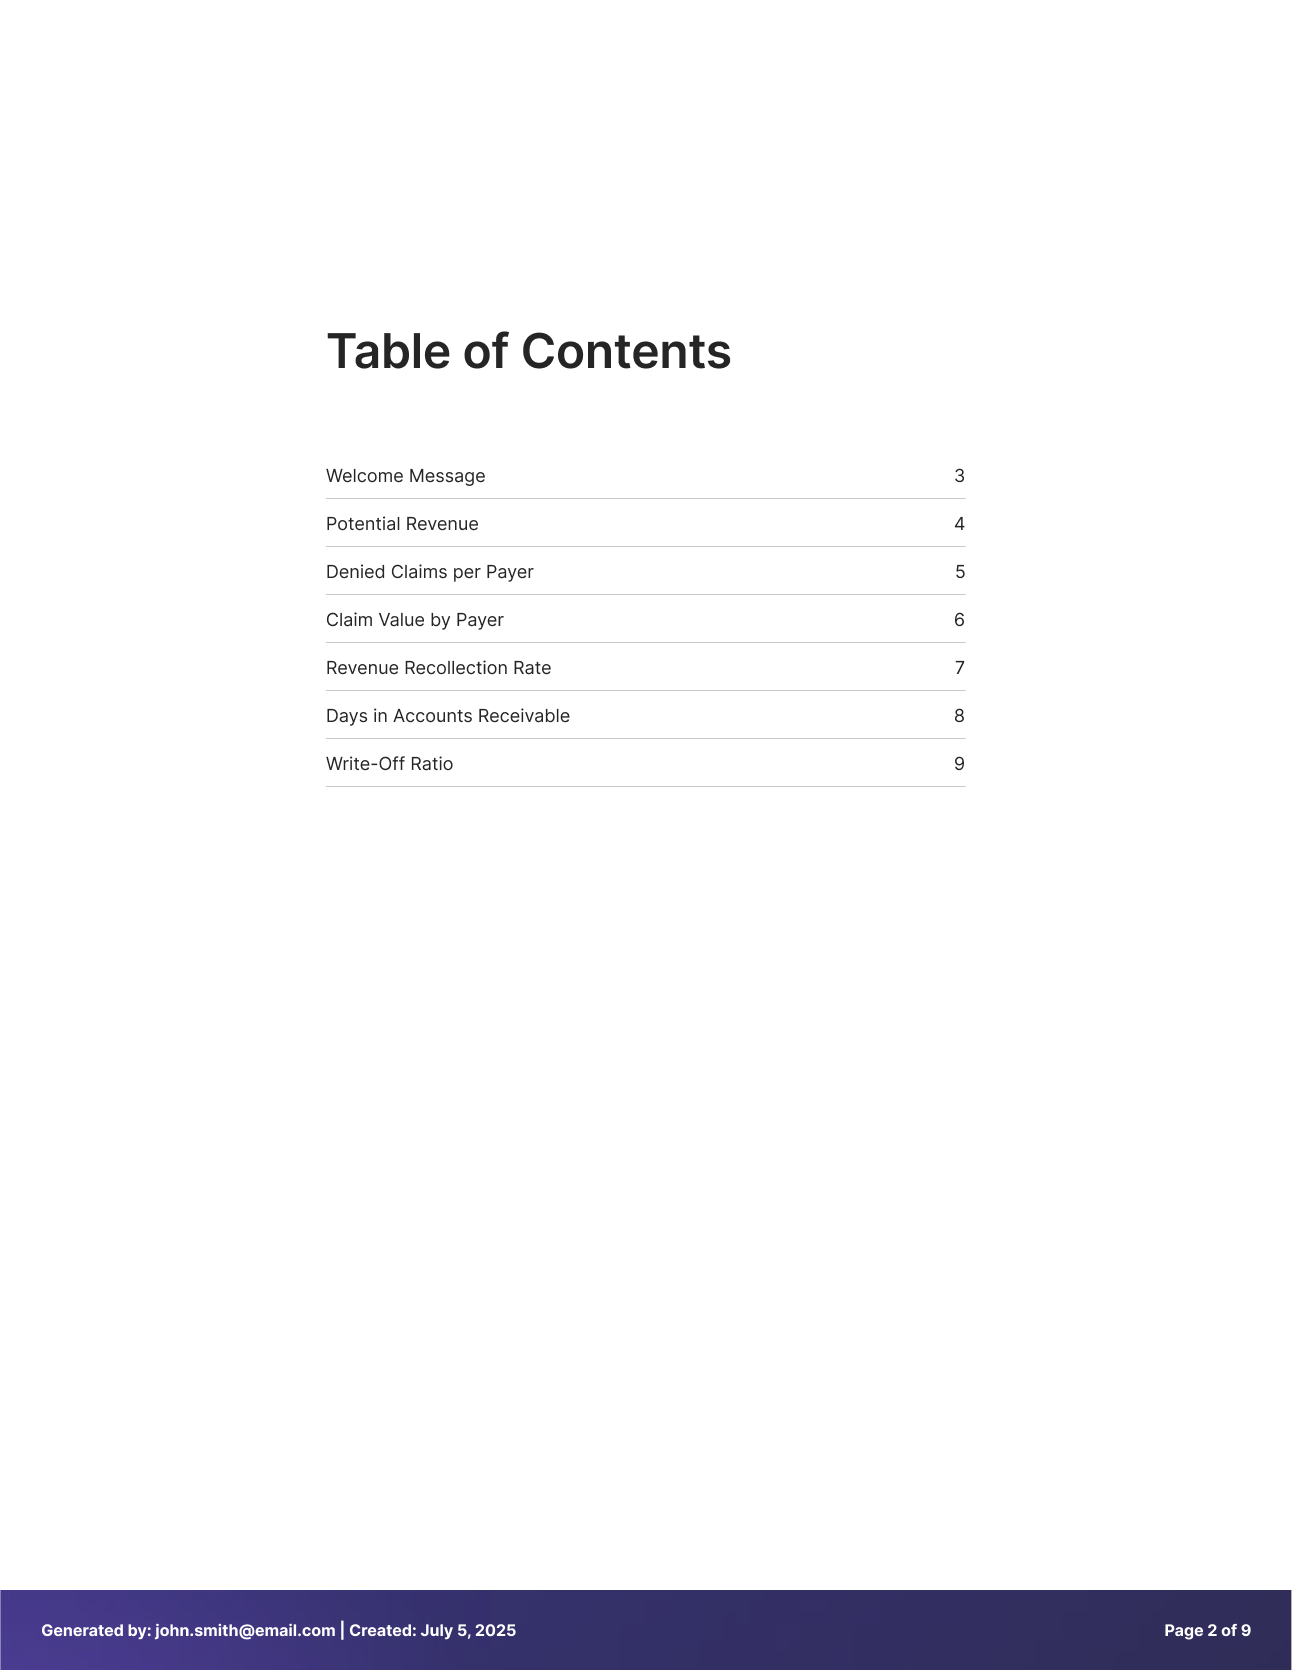
- Table of Contents: Navigational overview with page numbers
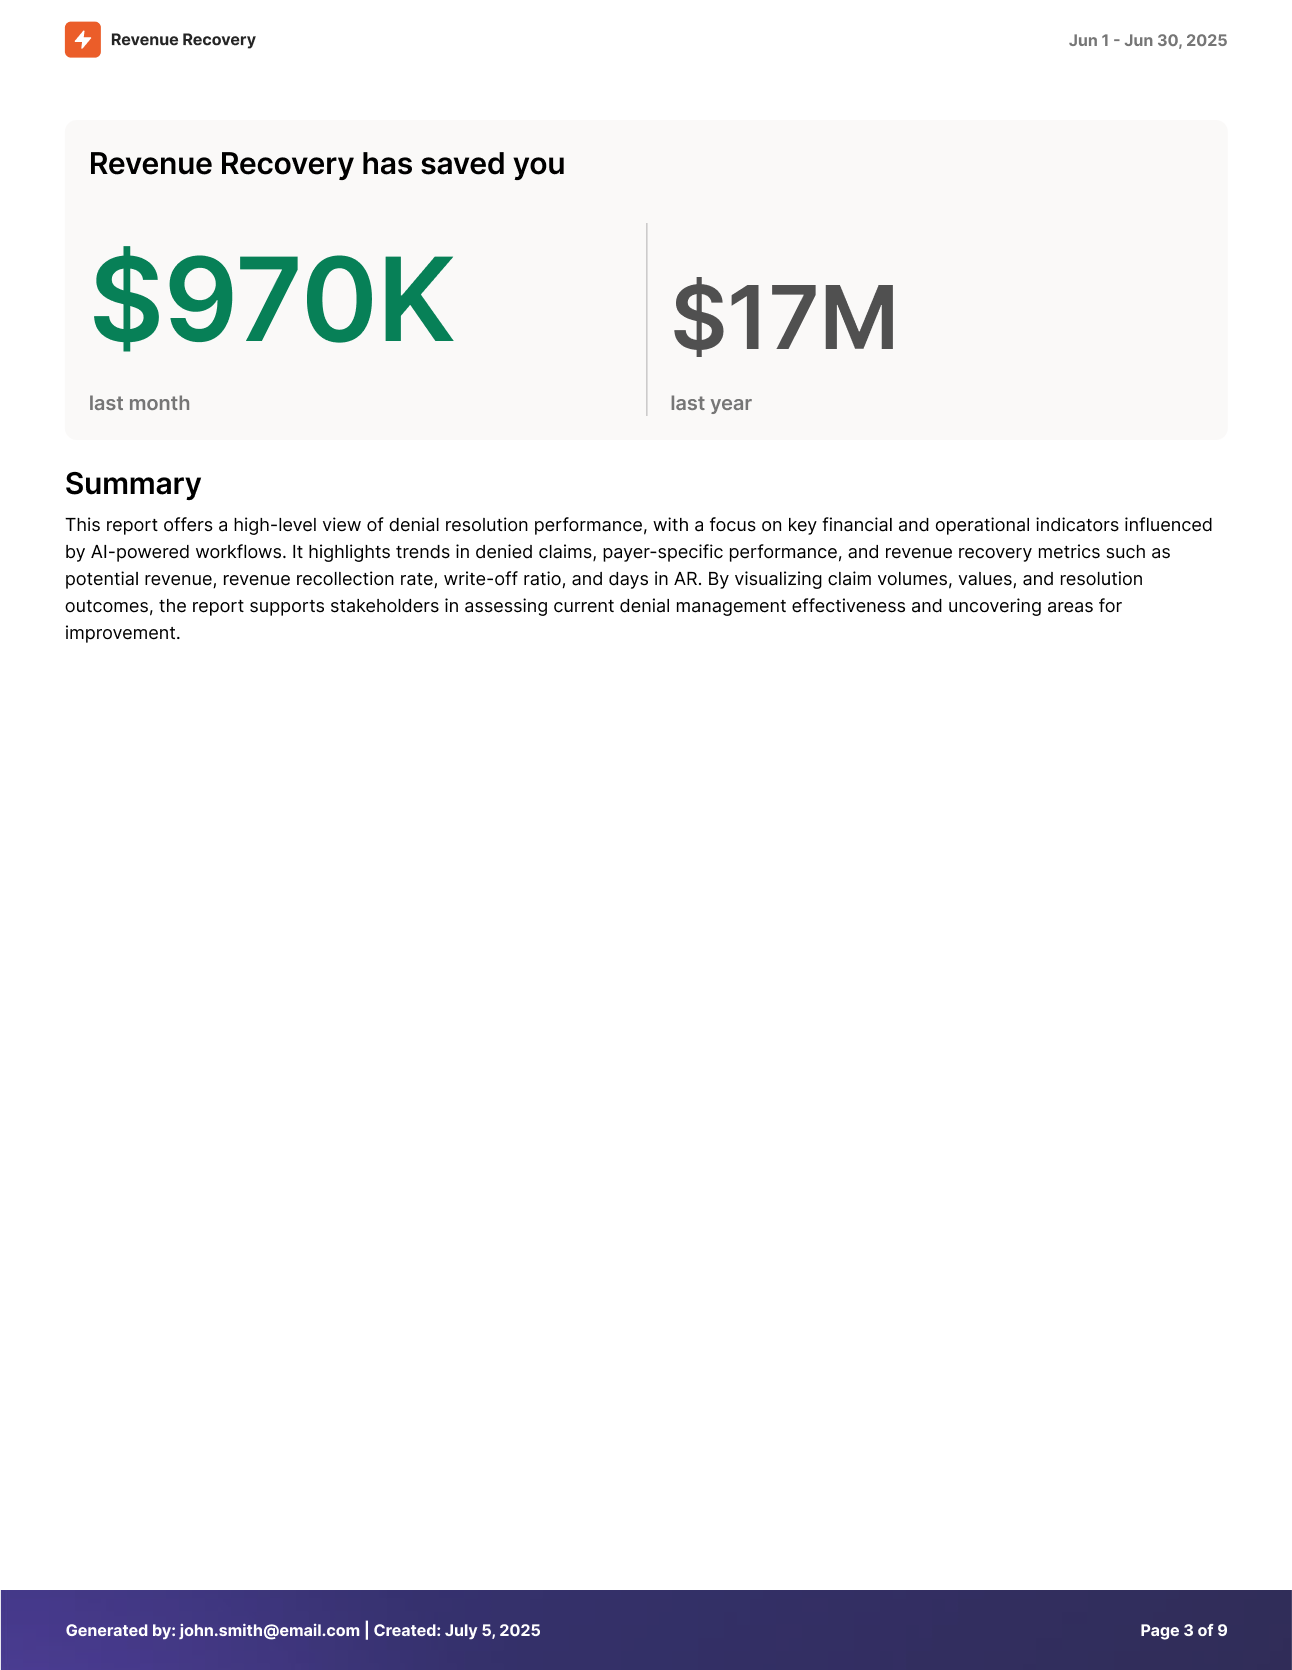
- Executive Summary: Welcome message and key financial metrics
- Individual Widget Pages: Detailed analysis for each dashboard widget
- Professional Headers/Footers: Consistent branding and page information
Cover Page and Report Details
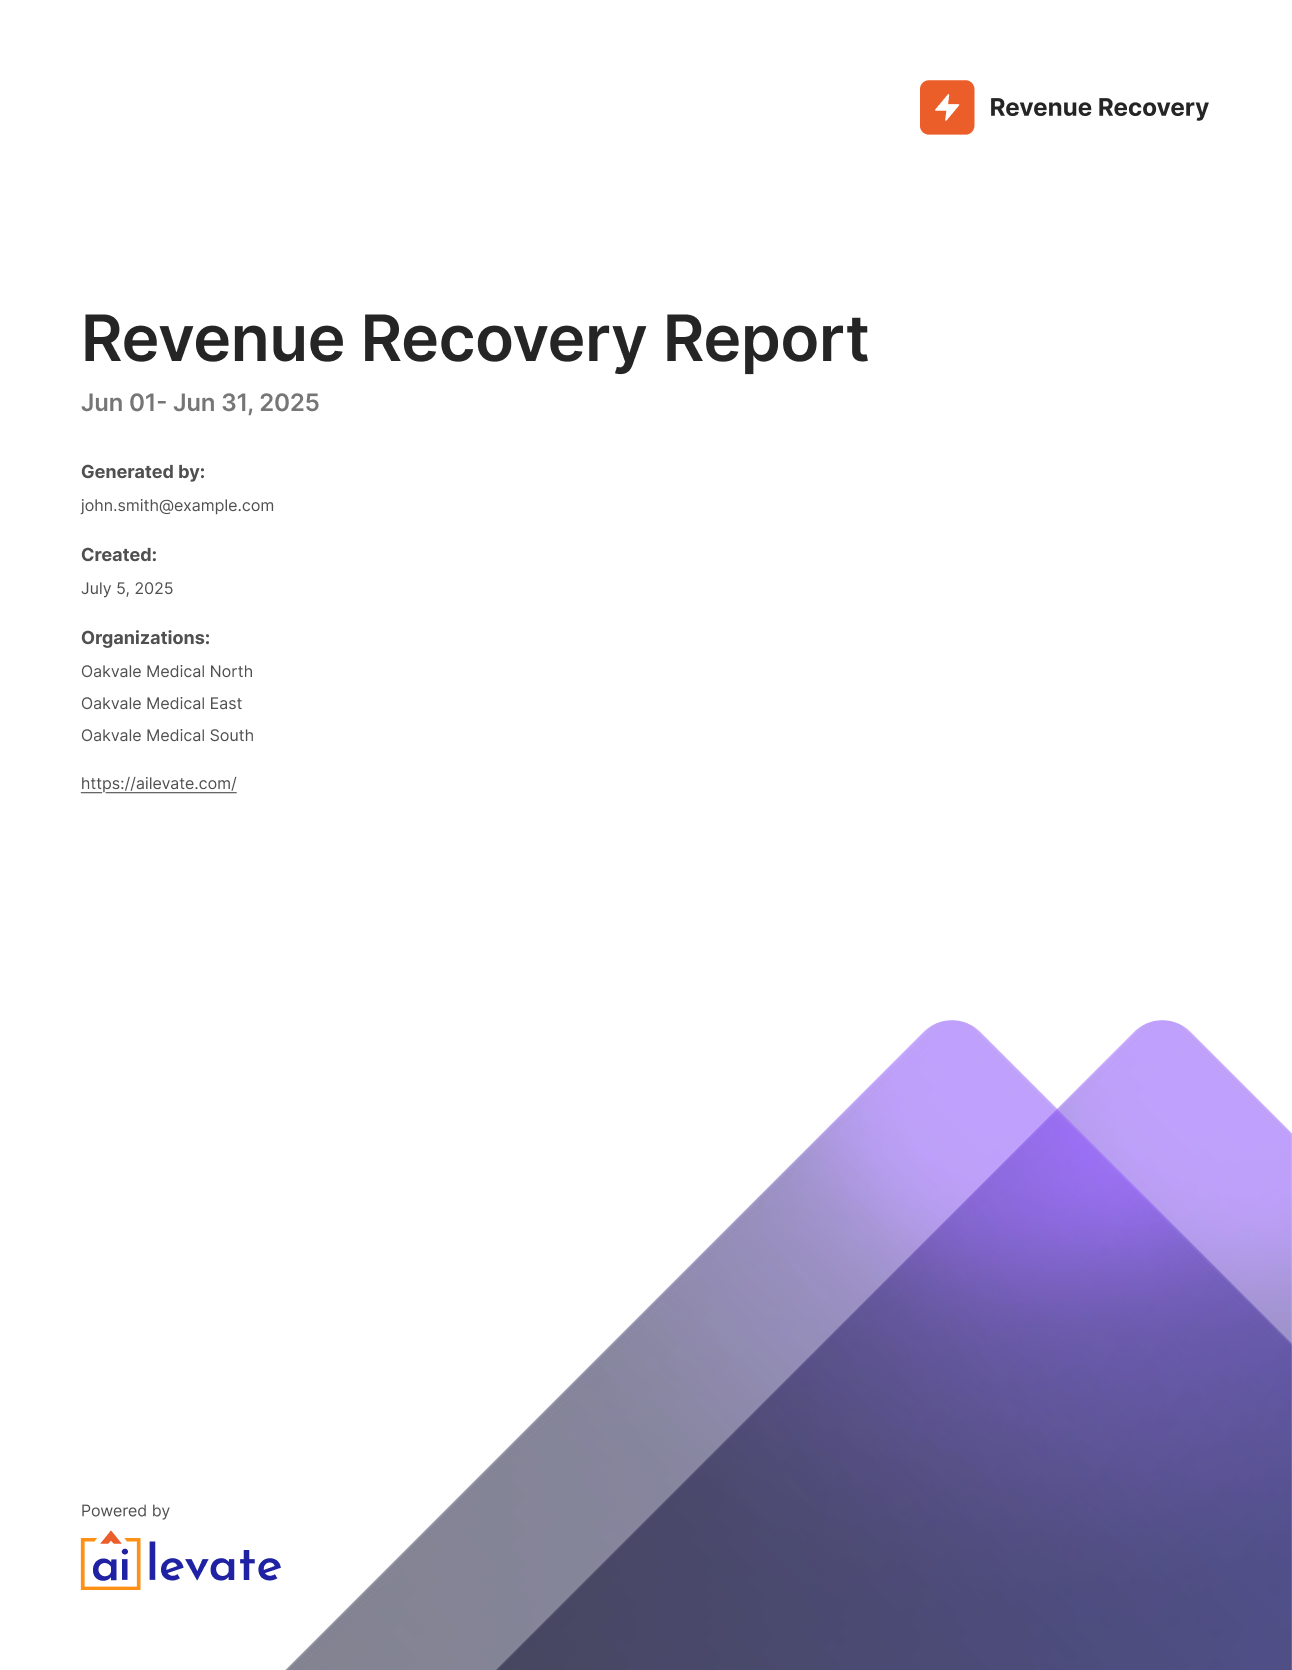
The cover page provides essential report context and professional branding, featuring the Revenue Recovery logo, report title, date range, and generation metadata for tracking and compliance purposes.
Content Included:
- Revenue Recovery branding and report title
- Date range and organization context
- Report generation timestamp and user information
- Professional layout suitable for executive distribution
Table of Contents
This page presents a comprehensive table of contents with page numbers, enabling easy navigation through the printed report and quick reference to specific sections.
Executive Summary
The third page focuses on high-level executive insights, featuring the personalized welcome message and key revenue recovery metrics in a format optimized for leadership presentations.
Content Included:
- Personalized welcome message with highlighted opportunities
- "Revenue Recovery has saved you" summary metrics
- Period-over-period comparison (7 days vs. annual)
- Specific claim callouts with revenue potential
Use Cases:
- CFO Reports: High-level financial impact summaries for board presentations
- Monthly Reviews: Executive dashboards for leadership team meetings
- Stakeholder Updates: Concise performance overviews for external partners
Detailed Widget Analysis
The remaining pages provide comprehensive analysis of each dashboard widget, with dedicated pages for detailed charts, trend analysis, and supporting metrics.
Potential Revenue Analysis
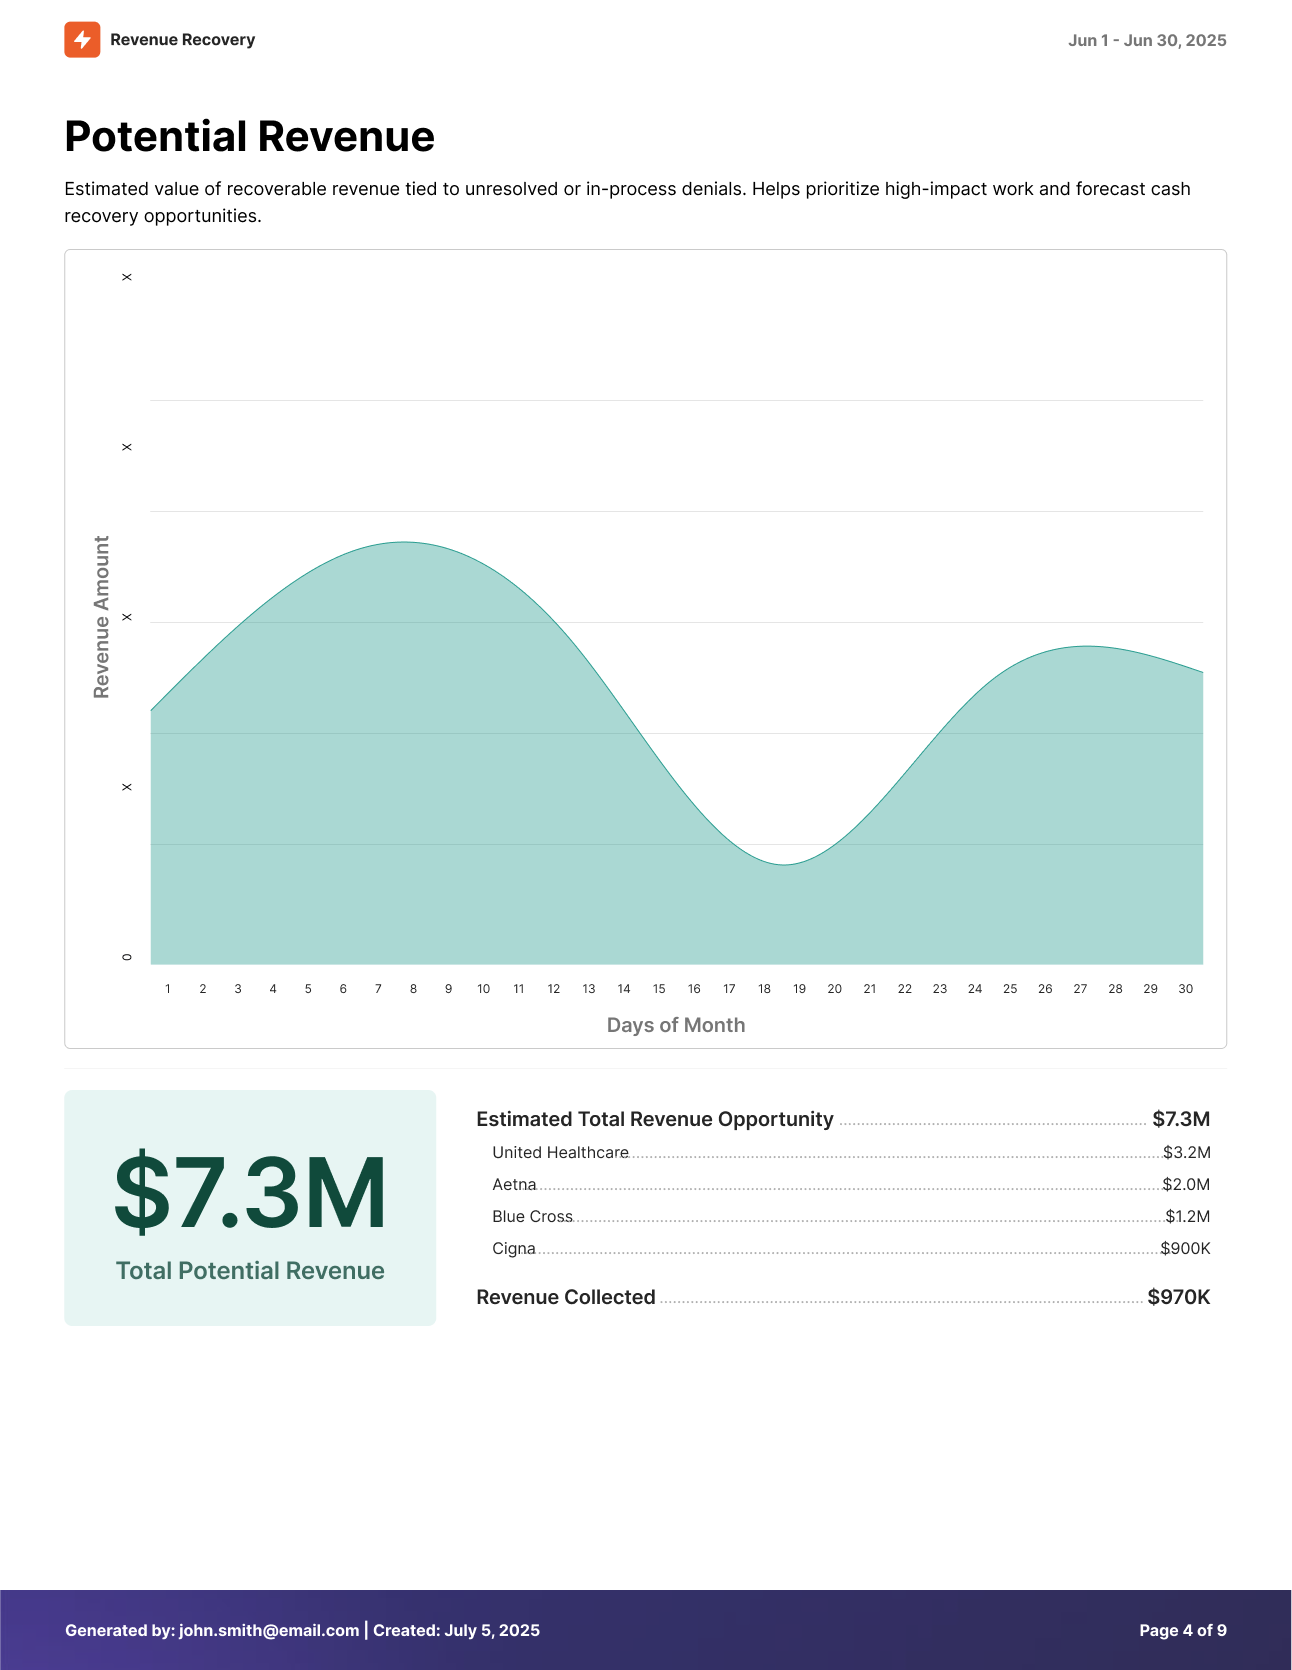
Content Included:
- Detailed trend chart showing daily potential revenue patterns
- Total potential revenue calculation for the selected period
- Breakdown of estimated total revenue opportunity vs. revenue collected
- Visual indicators for revenue trending and recovery potential
Use Cases:
- Cash Flow Planning: Forecast potential revenue recovery for financial planning
- Resource Allocation: Prioritize denial recovery efforts based on revenue impact
- Performance Tracking: Monitor trends in potential revenue over time
Denied Claims per Payer Analysis
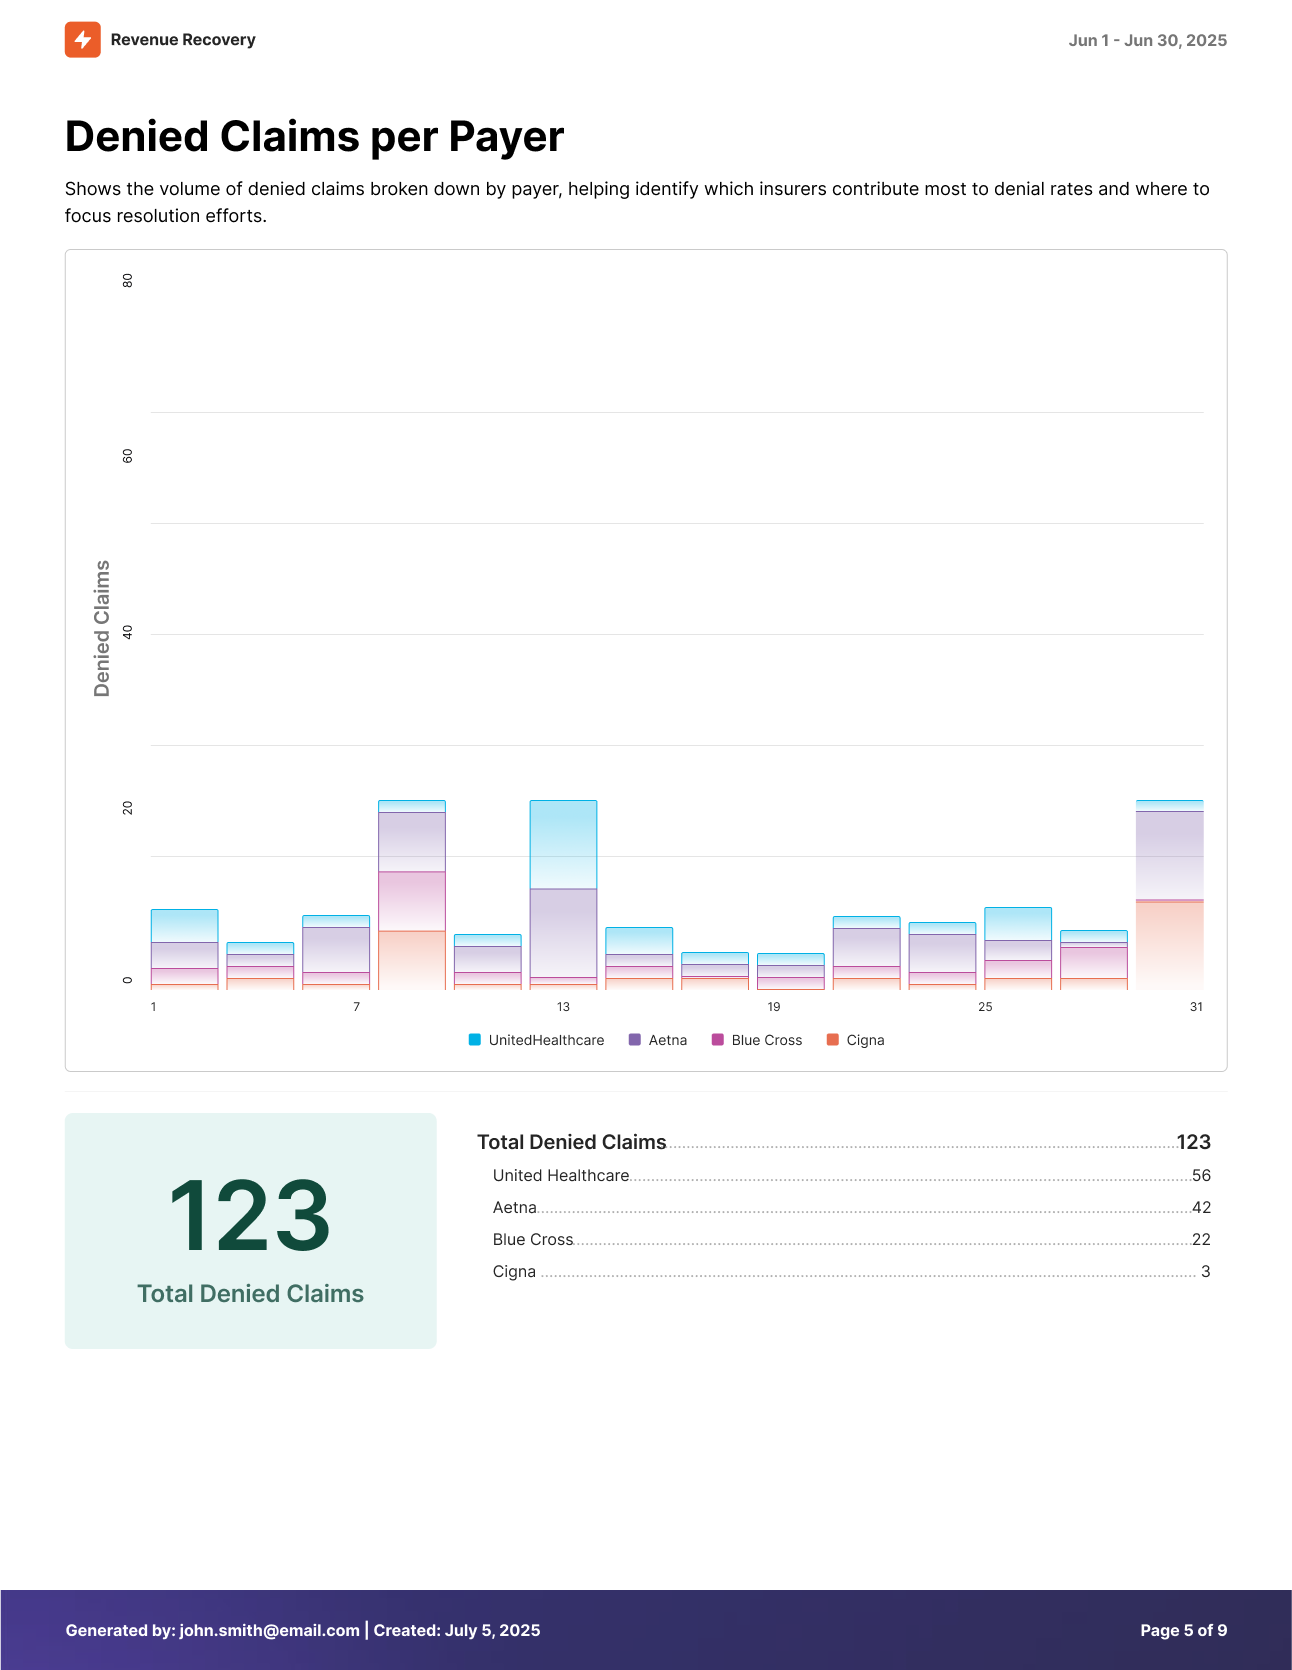
Content Included:
- Volume-based chart showing denial patterns by date
- Total denied claims count for the reporting period
- Payer-specific breakdown (when data is available)
- Trend analysis for denial frequency patterns
Use Cases:
- Payer Relationship Management: Identify problematic payers requiring attention
- Process Improvement: Target denial prevention efforts for high-volume payers
- Workload Distribution: Balance denial processing across team members
Claim Value by Payer Analysis
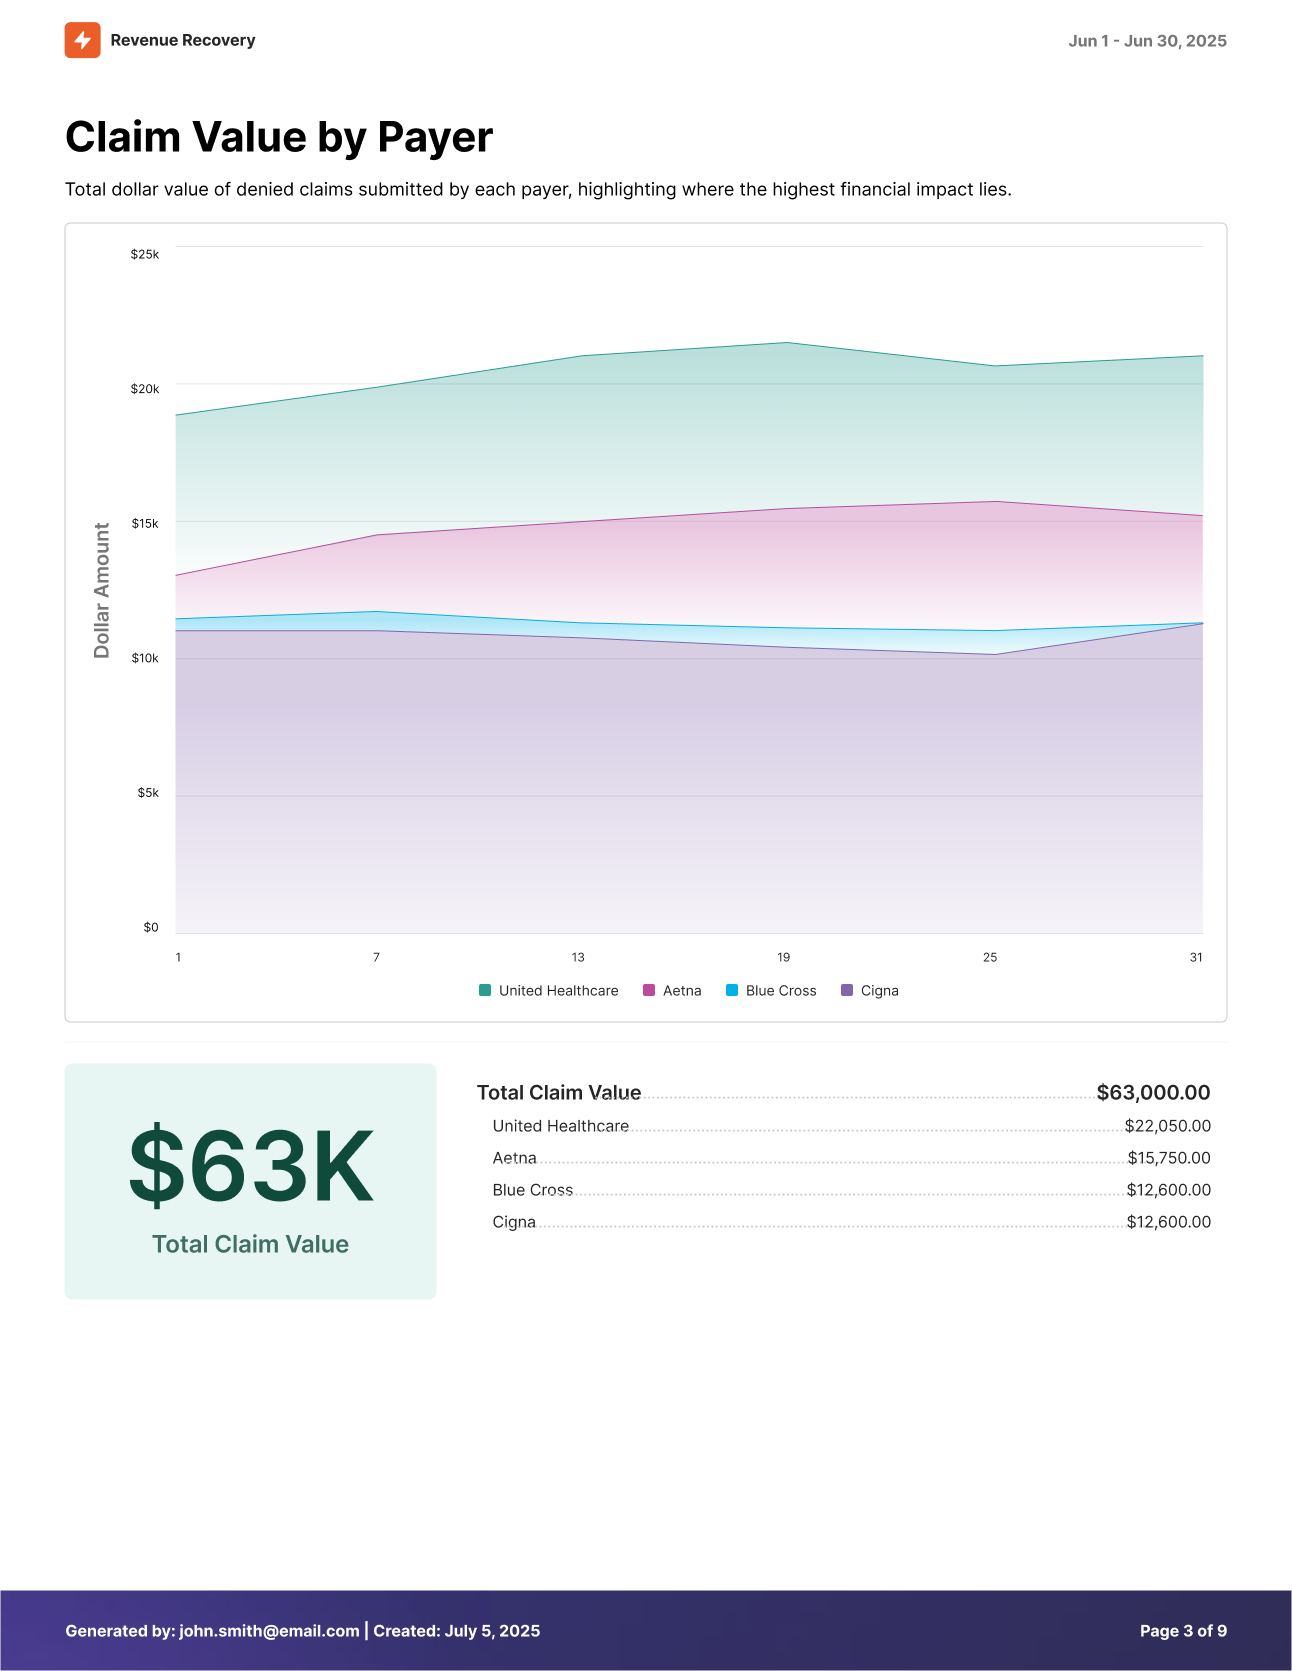
Content Included:
- Financial impact chart showing dollar values of denied claims
- Total claim value calculations for the period
- Payer-specific value analysis
- Revenue impact trending for strategic decision-making
Use Cases:
- Financial Impact Assessment: Quantify revenue at risk by payer
- Contract Negotiations: Support payer contract discussions with data
- Investment Justification: Document financial impact for tooling, training, and other investments
Revenue Recollection Rate Analysis
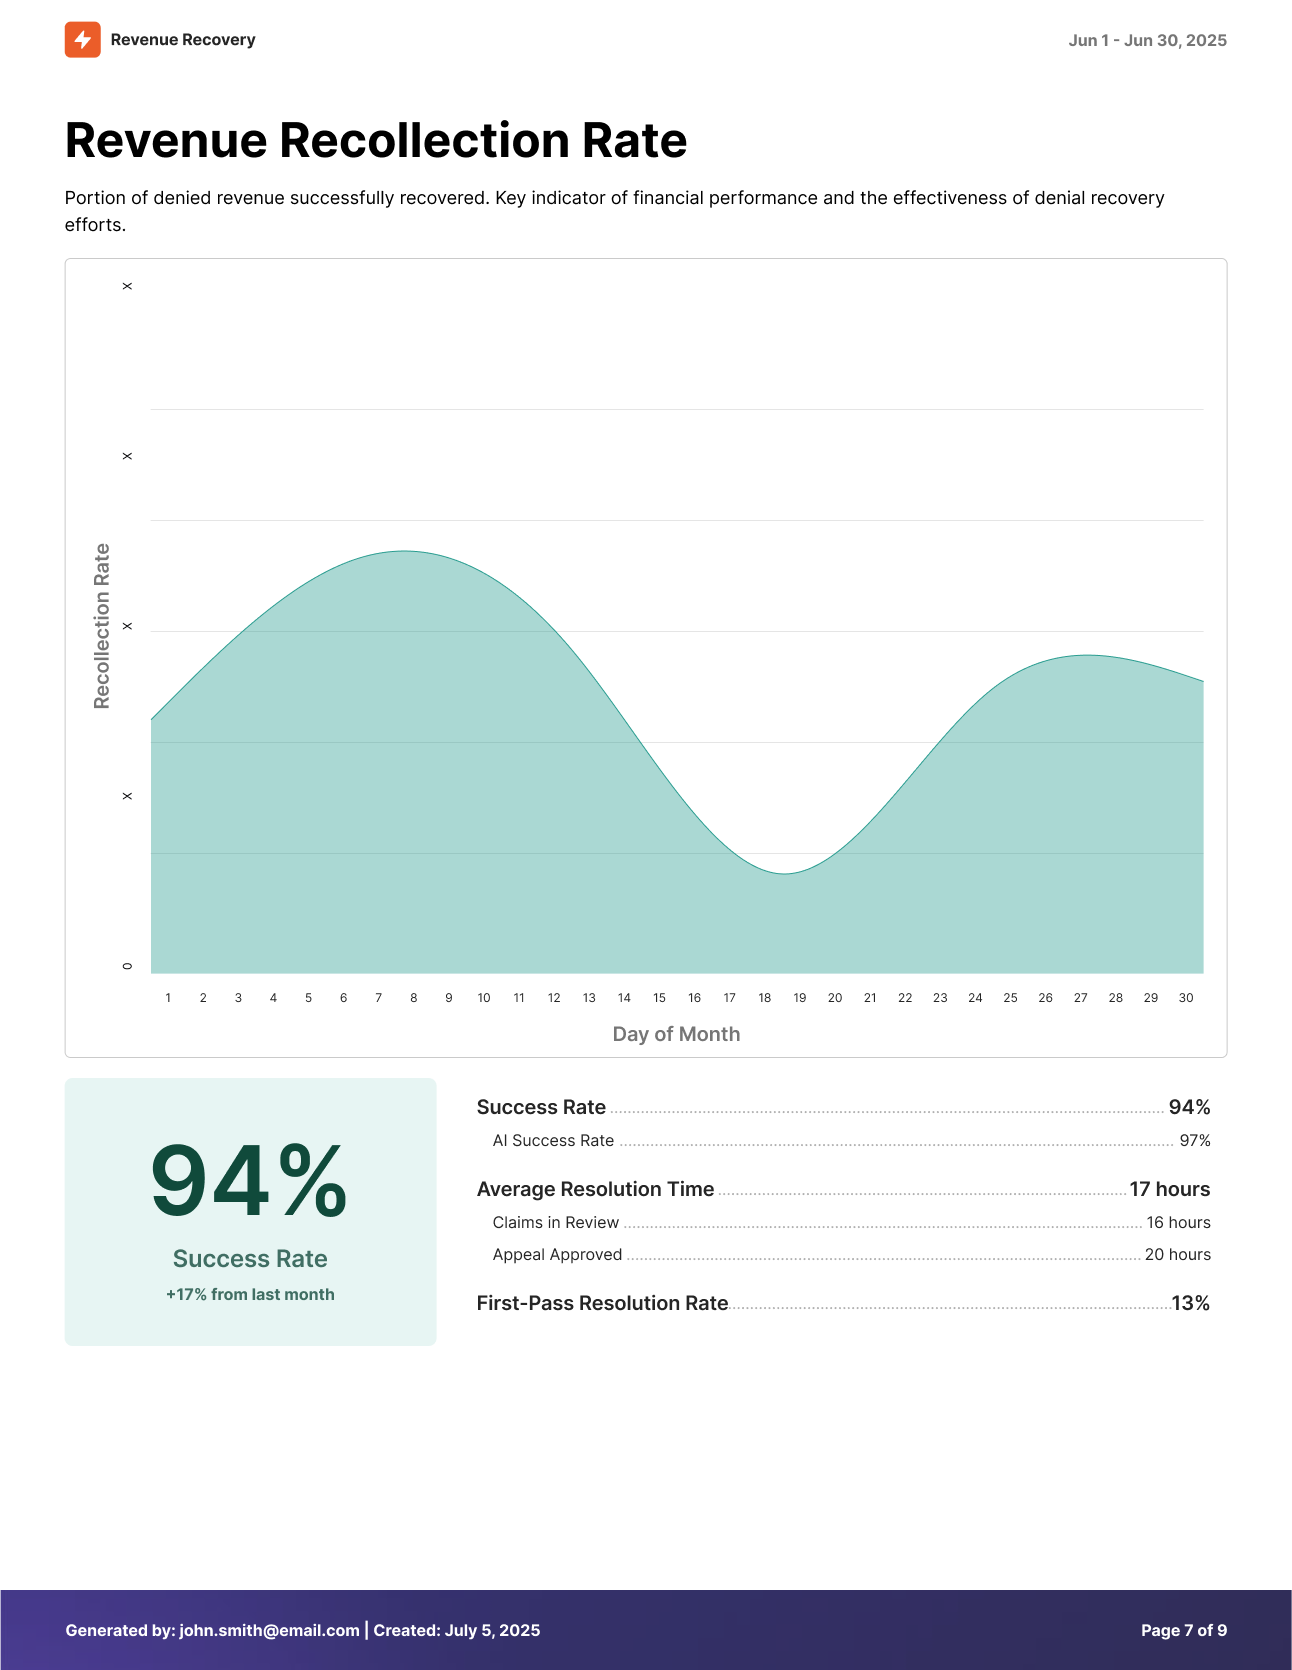
Content Included:
- Success rate trending showing recovery effectiveness over time
- Total recovery percentage for the reporting period
- First pass resolution rate metrics
- Performance indicators for process efficiency
Use Cases:
- Team Performance Reviews: Objective metrics for staff evaluations
- Process Optimization: Identify opportunities for improvement
- Benchmarking: Compare performance against industry standards
Days in Accounts Receivable Analysis
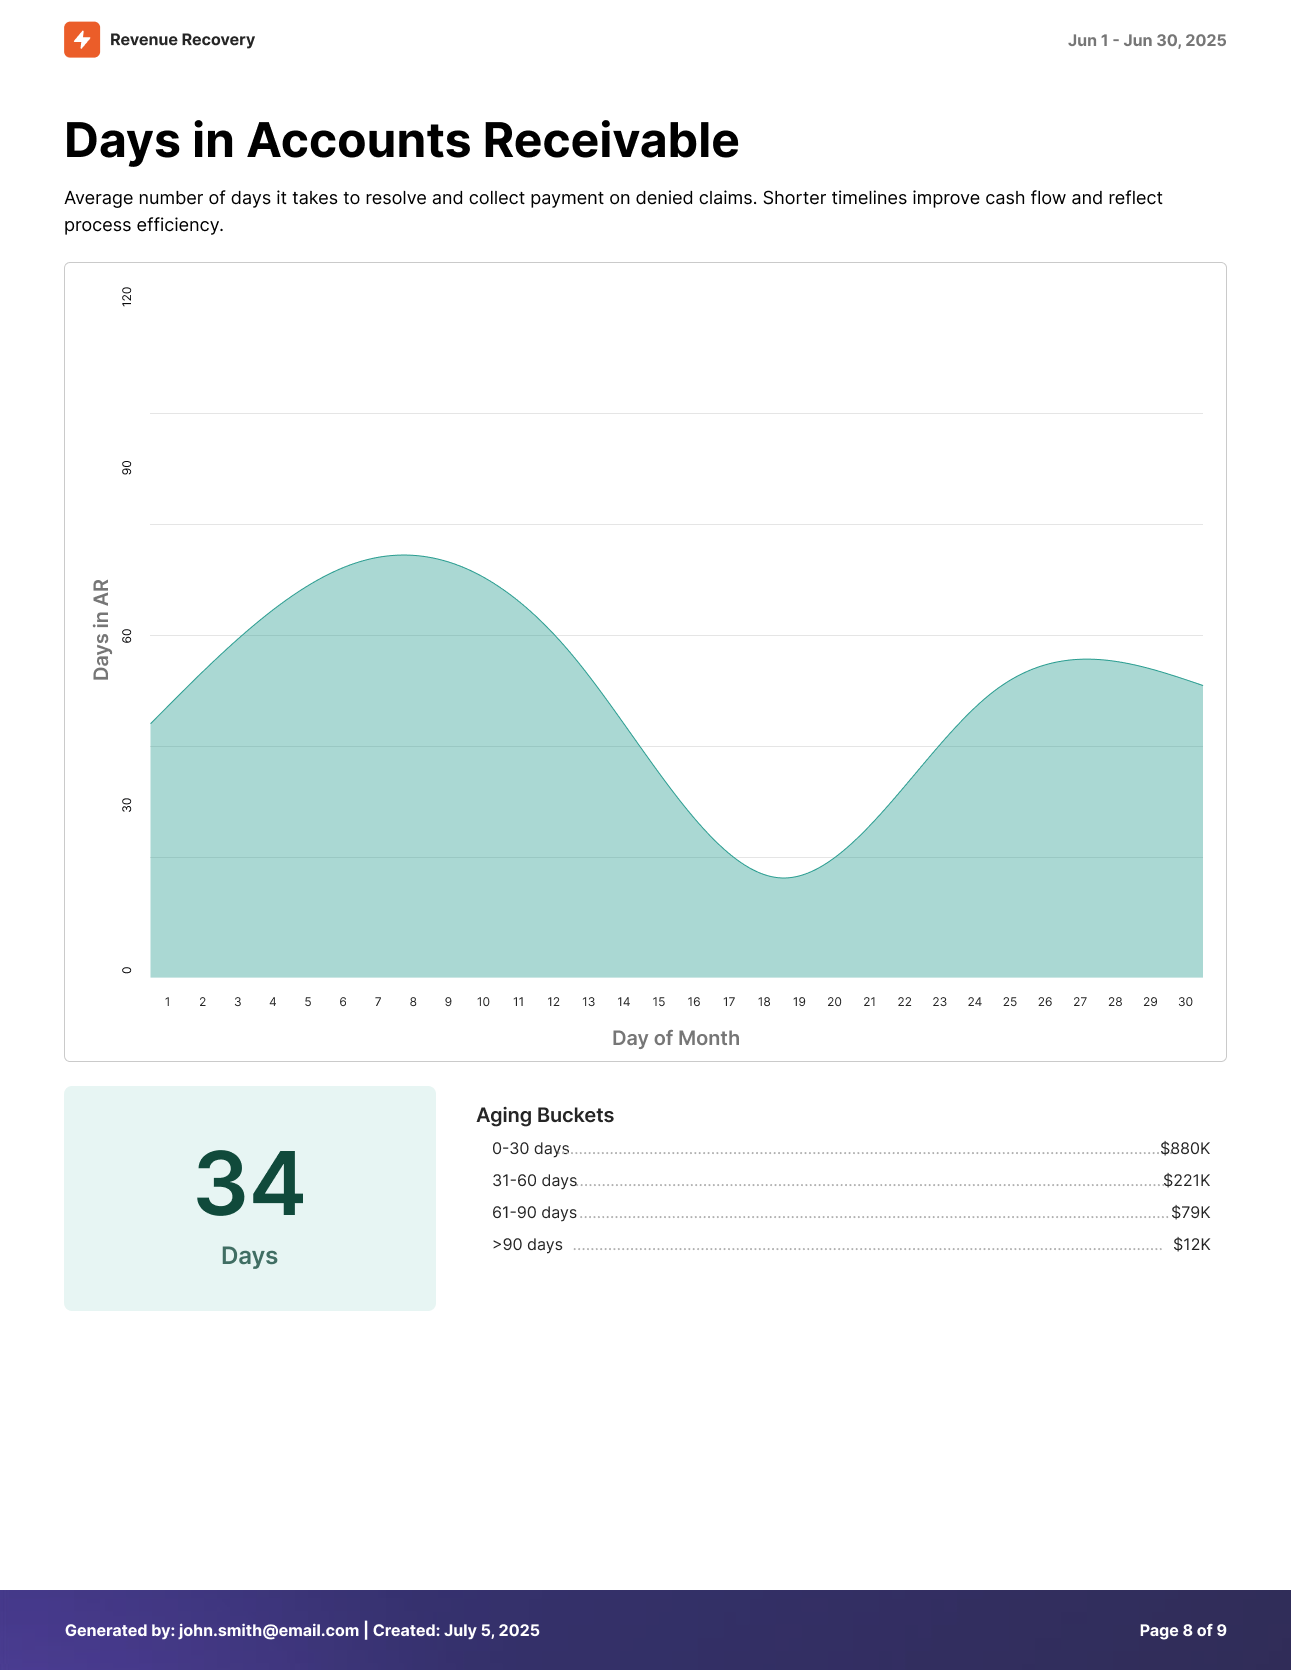
Content Included:
- Aging analysis with detailed breakdown by time periods
- Average days to resolution for denied claims
- Aging buckets (0-30, 31-60, 61-90, >90 days) with specific counts
- Cash flow impact indicators for financial planning
Use Cases:
- Cash Flow Management: Monitor and improve collection timelines
- Process Efficiency: Identify bottlenecks in denial resolution workflows
- Financial Planning: Forecast cash receipts based on aging patterns
Write-off Ratio Analysis
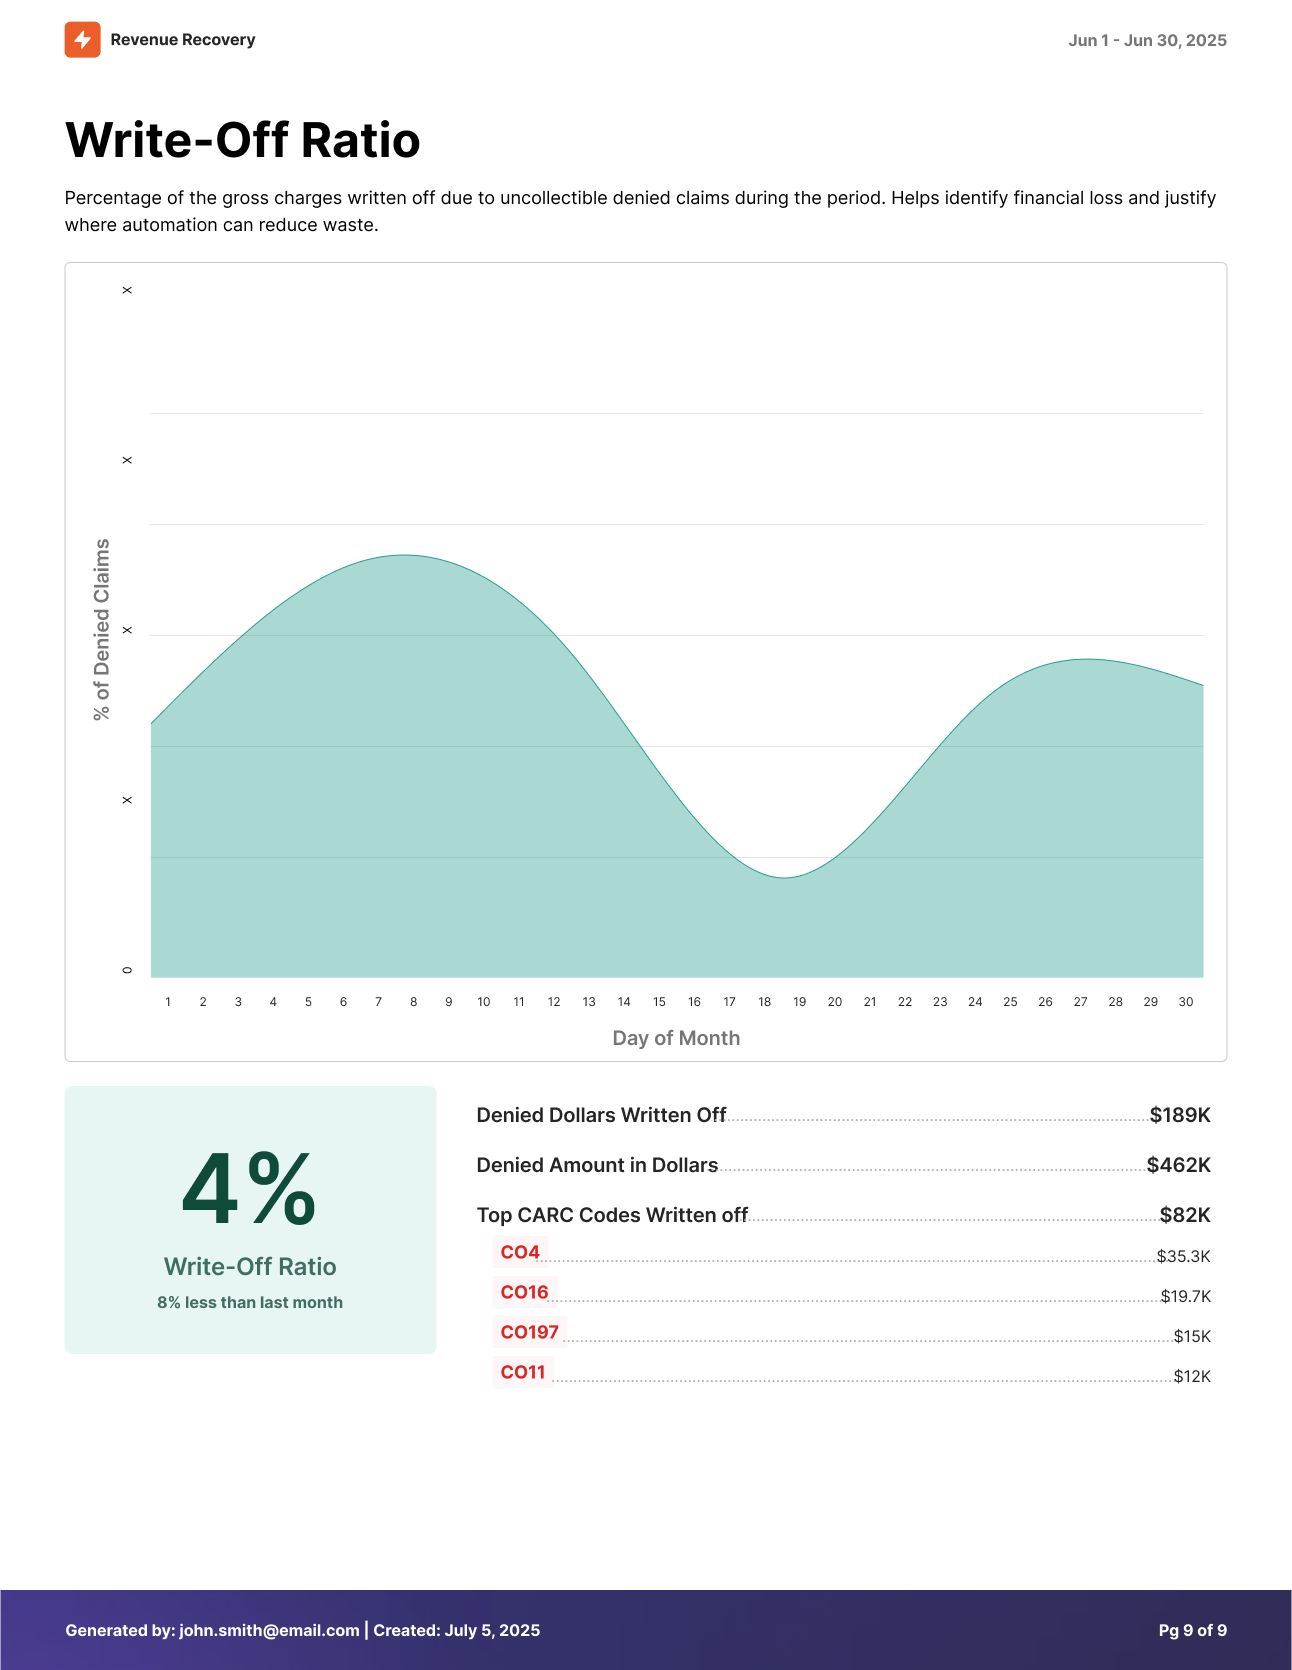
Content Included:
- Write-off percentage calculations and trending
- Detailed breakdown of denied dollars written off
- Top CARC (Claim Adjustment Reason Codes) analysis
- Financial loss indicators for process improvement
Use Cases:
- Financial Loss Prevention: Monitor and reduce uncollectible write-offs
- Process Improvement: Identify common reasons for claim write-offs
- ROI Justification: Document potential savings from improved denial management
Print Formatting
The print view includes several formatting enhancements that ensure professional presentation and optimal readability across different output formats.
Professional Styling
- Clean, high-contrast layouts optimized for black and white printing
- Consistent font sizing and spacing for excellent readability
- Chart and graph formatting that translates well to print media
- Logical page breaks that maintain content integrity
- Ample whitespace to allow for marking up and note taking in meetings
Header and Footer Information
- Organization name and report generation timestamp
- Page numbering and section identification
- Selected filters and time period context
- Contact information for report questions or follow-up
Customization Tips
- Adjust time periods to align with reporting cycles and business requirements
- Apply organization or payer filters to create targeted reports for specific audiences
- Review data accuracy and completeness before generating critical business reports
- Include contextual notes or annotations when presenting unusual trends or significant changes
The print functionality transforms interactive dashboard insights into professional documentation that supports decision-making, compliance requirements, and stakeholder communication across your organization.
Updated 9 months ago